IR-06 · kubernetes
Pushkar Kumar 6 min read
OOMKilled and exit code 137: why Kubernetes killed your pod
Exit code 137 means the kernel killed your container for exceeding its memory limit. How to confirm it, and why raising the limit is usually the wrong fix.
On this page
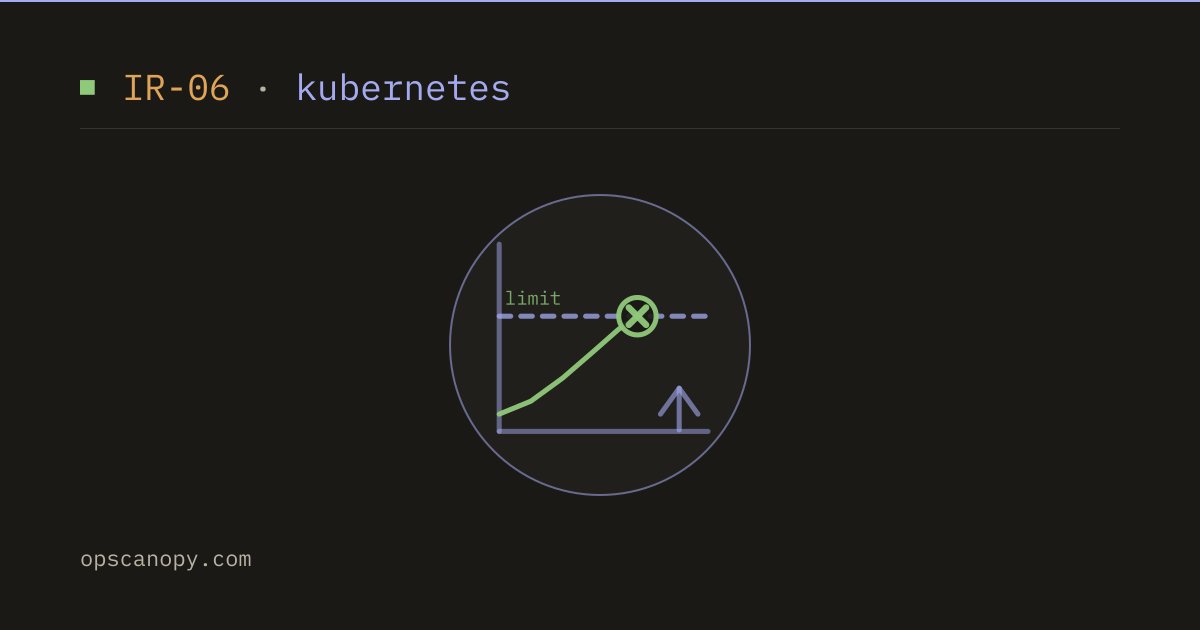
A pod is restarting and you can’t see why. The logs end mid-request with nothing that looks like a crash. Then you describe it:
    State:          Running
    Last State:     Terminated
      Reason:       OOMKilled
      Exit Code:    137
      Started:      Mon, 29 Aug 2026 09:14:02 +0000
      Finished:     Mon, 29 Aug 2026 09:41:37 +0000
    Restart Count:  6
Two things are worth knowing immediately. Your application did not crash — it was killed from outside, by the Linux kernel, with SIGKILL. And there is no graceful shutdown and no stack trace, because SIGKILL cannot be caught. That silence in the logs is the expected symptom, not a missing clue.
What 137 actually means
137 is 128 + 9. The 128 marks “terminated by signal”, and 9 is SIGKILL. So exit code 137 means something sent SIGKILL — most often the kernel’s OOM killer, but not always.
The distinction that matters:
Reason: OOMKilled— the container exceeded its memory limit. The kernel’s cgroup OOM killer terminated it.Reason: Error, exit code 137 — something else sent SIGKILL. Usually aterminationGracePeriodSecondsthat expired: Kubernetes sent SIGTERM, the process ignored it or shut down too slowly, and Kubernetes escalated to SIGKILL.
Read the Reason field before assuming memory. The second case is a shutdown-handling bug and no amount of extra memory will fix it.
kubectl describe pod <pod> | grep -A4 "Last State"Confirm it, don’t infer it
Restart Count going up with OOMKilled in Last State is the confirmation. To see the pattern rather than a single instance:
# Which containers have OOMed, across the namespace
kubectl get pods -o json \
  | jq -r '.items[] | .metadata.name as $p
      | .status.containerStatuses[]?
      | select(.lastState.terminated.reason=="OOMKilled")
      | "\($p)\t\(.name)\trestarts=\(.restartCount)"'
Also check events, which sometimes name the node-level pressure that triggered it:
kubectl get events --field-selector reason=OOMKilling -AWhy raising the limit is often the wrong first move
The reflex is to double limits.memory and move on. Sometimes that is correct — the limit was simply set below what the workload legitimately needs. Often it isn’t, and it converts a fast, obvious failure into a slow, expensive one.
Ask which of these you have:
A limit that was always too low. The container OOMs quickly and consistently, often within seconds of starting, at roughly the same memory figure every time. Raising the limit is the right fix.
A leak. Memory climbs steadily over minutes or hours until it hits the ceiling, and the time-to-OOM is proportional to the limit. Doubling the limit doubles the time between restarts and fixes nothing. The tell is that Started and Finished in Last State are far apart, and the interval grows when you raise the limit.
A runtime that ignores the cgroup. The JVM before it was container-aware, Node’s default old-space, Go with no GOMEMLIMIT — the runtime sizes its heap against the node’s total memory, not the container’s limit, then confidently allocates past the ceiling. This is extremely common and looks exactly like a leak from the outside.
For the JVM, use the container-aware flags rather than a fixed -Xmx:
env:
  - name: JAVA_TOOL_OPTIONS
    value: "-XX:MaxRAMPercentage=75.0"
For Go 1.19+, tell the runtime the ceiling so the garbage collector works against the real budget:
env:
  - name: GOMEMLIMIT
    valueFrom:
      resourceFieldRef:
        resource: limits.memory
resourceFieldRef reads the container’s own limit, so the two can never drift apart.
The requests-versus-limits mistake behind most of it
Memory and CPU behave completely differently under pressure, and conflating them causes a lot of unnecessary OOMKills.
- CPU is compressible. Exceed the CPU limit and you get throttled — slower, but alive.
- Memory is not. Exceed the memory limit and you are killed. There is no “a bit slower” state.
That asymmetry has a direct consequence: CPU limits are optional and often harmful; memory limits are essential.
The second half is the Quality of Service class, which decides who gets killed first when the node runs out of memory:
| requests vs limits | QoS class | Eviction order |
|---|---|---|
| Not set | BestEffort | Killed first |
| requests < limits | Burstable | Middle |
| requests == limits | Guaranteed | Killed last |
A pod with no memory request is BestEffort and is the first thing evicted under node pressure — even if it was using very little. If a workload matters, give it a request. For anything latency-sensitive, set request equal to limit and get Guaranteed.
resources:
  requests:
    memory: "512Mi"
    cpu: "250m"
  limits:
memory: "512Mi" # equal to request -> GuaranteedSizing it, and checking what it costs
Base the number on observation, not a guess. Use the working set over a representative window — including whatever your peak actually is:
max_over_time(
  container_memory_working_set_bytes{pod=~"my-app-.*", container!=""}[7d]
)
Take that peak and add headroom — commonly 20–30%, more if traffic is spiky. Note that container_memory_working_set_bytes is the metric the OOM killer effectively acts on, which is why it is the right one here rather than container_memory_usage_bytes (which includes reclaimable cache and will overstate your need).
Once you have a per-container number, the arithmetic across replicas is where mistakes creep back in — millicores and Mi/Gi units, multiplied by replica counts, summed across containers including sidecars. The Kubernetes Resource Calculator totals CPU and memory requests and limits across containers and replicas and converts the units, so you can see what a deployment actually reserves on the cluster before you apply it.
To be clear about what that does and does not do: it will not tell you why a container OOMed — that comes from the metric above and the runtime’s own behaviour. What it answers is the question that follows, which is whether the limit you just chose, multiplied by every replica, still fits the nodes you have.
A working order
kubectl describe podand readReason.OOMKilledis memory;Errorwith 137 is a shutdown-grace problem instead.- Check whether time-to-OOM scales with the limit. If it does, you have a leak or a runtime ignoring the cgroup — fix that, don’t raise the ceiling.
- If the runtime is the JVM, Node or Go, make it container-aware before touching limits.
- Size from
max_over_time(container_memory_working_set_bytes[7d])plus headroom. - Set a memory request as well as a limit, so the pod isn’t
BestEffortand first to be evicted. - Total it across replicas and confirm it still fits the node pool.
The recurring theme: exit code 137 is a report that something exceeded a boundary, not a description of the bug. The useful question is never “how much memory should I add” but “does this workload’s memory grow with time, and does its runtime know what its ceiling is”.
A pod that keeps restarting also keeps dropping out of its Service, because it is never Ready long enough to receive traffic. If the restarts stop but the Service still sends nothing, work through why a Kubernetes Service has no endpoints: selector, EndpointSlice, then readiness.
Related posts
-
10 min read
Kubernetes Service has no endpoints: find the selector bug
A Kubernetes Service has no endpoints, or a Deployment says selector does not match template labels? One bug, two symptoms, and how to trace both to a fix.
-
12 min read
Unable to get local issuer certificate: curl, git, npm, pip
Why curl, git, npm and pip print unable to get local issuer certificate, which trust store each one reads, and the fixes that add a CA instead of replacing it.
-
7 min read
Why your GitHub Actions workflow didn't trigger
Branch name mismatches, the AND-semantics of branches + paths, the ** glob requirement and paths-ignore on pull_request — with the fix for each.